
This post from Lone Star Left intrigued me.
Gee, we’re like 48 days away now. And I promised you a few other pieces of content beforehand. This is part of my county series. If you missed the previous installments:
- How Important Is Dallas County In The 2026 Election?
- How Important Is Harris County In The 2026 Election?
- How Important Is Tarrant County In The 2026 Election?
I know, I’ve gone a little bananas with the headline, but I thought it was time to break up the monotony. Besides, if you haven’t heard, Votehub has moved Texas to “Lean Dem,” and on their map, they have Collin County as BLUE.
And for those of you with particularly sharp eyes, you may have also noticed they have the entire RGV, WilCo, and Jefferson County blue as well. However, Brazoria and Bell Counties still look pink. But of course, Votehub has been wrong before.
Regarding Collin County, though. This county is ready to flip. This is a county I have said (for years) is the next flip in DFW after Tarrant.
I agree with that assessment. She goes on to a deeper dive of Collin County that you should read – I think there’s an overemphasis on turnout and not enough on people voting differently, which is clearly a huge driver of the polls these days, but turnout is for sure important – but I wanted to focus a bit on the embedded map:
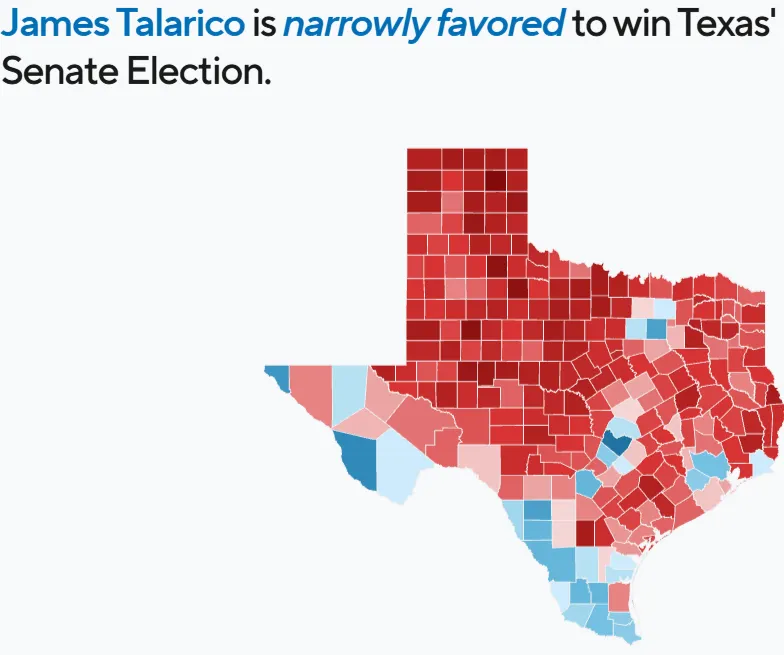
That dark blue spot in the center is of course Travis County, and its blue neighbors to the north and south are Williamson and Hays. No surprises there, but I was fascinated by the light blue county bordering Hays to the east. That’s Caldwell County, which I doubt is on most people’s radar as a potential blue spot. I will say, I noticed that Caldwell, while not exactly trending blue in the Presidential years from 2012 to 2020, it was holding its own. It backslid in 2024, as everywhere else did, but still came in at 42.2% that accursed year.
Tarrant County is of course blue in this map as well. I wanted to do my own exploration of this, so I broke out Excel and played around with the Beto percentages in 2018 and 2022. They’re not a true apples-to-apples comparison, but they were the top of the ticket races those years, and it’s the best I can do. Here are the counties in which Beto got between 40 and 50 percent in 2018, and how he did in those counties in 2022.
County      Cruz18   Beto18  Abbott22    Beto22
===============================================
BRAZORIA    58.78%   40.47%    59.07%    39.44%
KENEDY      55.56%   42.78%    71.24%    27.45%
BRAZOS      55.78%   43.23%    59.66%    38.53%
HUDSPETH    54.56%   43.62%    66.89%    29.80%
BASTROP     54.87%   44.00%    57.15%    41.07%
BELL        54.79%   44.37%    59.01%    39.56%
UVALDE      54.80%   44.46%    60.14%    38.36%
DENTON      53.67%   45.52%    55.70%    42.92%
CALDWELL    53.54%   45.53%    55.92%    42.17%
COLLIN      52.65%   46.53%    54.34%    44.34%
TARRANT     49.24%   49.93%    51.34%    47.25%
Kenedy and Hudspeth are small rural counties that I’m not too concerned about. There’s Brazoria and Bell, both of which do look more likely to be light pink to me than light blue, with Tarrant and Collin poised to go over 50% for Dems, given that this year is expected to be 2018. And there’s Caldwell, right behind them, with the tiniest edge on Denton in terms of Beto’s performance, though slightly behind Denton in the difference between Beto and his opponent.
I don’t know about you, but I wouldn’t have guessed Caldwell would be in that spot. I suppose it’s a suburb of Travis County – it does border Travis, though it feels more remote that Hays or Williamson. Its county seat is Lockhart, and it is growing but doesn’t feel to me like a San Marcos or a Round Rock. Maybe I’m wrong about that – anyone in the area that wants to correct me, please do so. All I’m saying is that I will be delighted to see Caldwell go blue. To me, the question is, if Caldwell does go blue, why wouldn’t Denton as well? Or vice versa. Tune in later and find out.
By the way, one way to think about what I said about “people voting differently” versus “turnout” is to consider this list of counties where Beto got more than 50% in 2018, but less than 50% in 2022:
County      Cruz18   Beto18  Abbott22    Beto22
===============================================
JEFFERSON   49.48%   50.01%    56.02%    42.66%
NUECES      48.85%   50.38%    53.27%    45.32%
WILLIAMSON  47.96%   50.84%    49.43%    48.88%
KLEBERG	    47.48%   51.84%    53.40%    45.39%
VAL VERDE   46.87%   52.21%    58.16%    40.11%
REEVES      47.04%   52.34%    61.60%    36.79%
BREWSTER    45.99%   52.55%    53.52%    44.59%
JIM WELLS   45.66%   53.85%    53.05%    45.85%
LASALLE     45.20%   54.60%    52.96%    46.07%
FRIO        44.46%   54.78%    50.21%    48.04%
ZAPATA      36.93%   62.62%    52.77%    46.04%
CULBERSON   35.91%   63.00%    53.13%    44.57%
There’s Jefferson and Williamson, both projected to be blue as noted above. And there’s a bunch of Latino counties in South Texas and the Rio Grande Valley, many of which are also pegged to be blue this year. Consider also this partial list of counties in which Beto’s percentage, while still above 50 in 2022, dropped by more than ten points from 2018:
County      Cruz18   Beto18  Abbott22    Beto22
===============================================
HIDALGO     30.64%   68.81%    40.22%    58.55%
WEBB        27.97%   71.20%    36.70%    60.73%
EL PASO     25.02%   74.40%    34.80%    63.56%
VAL VERDE   46.87%   52.21%    58.16%    40.11%
ZAVALA      20.19%   79.29%    31.84%    67.02%
DUVAL       32.34%   67.23%    43.53%    54.90%
MAVERICK    27.38%   71.71%    40.30%    57.97%
JIM HOGG    27.74%   71.72%    42.15%    56.81%
REEVES      47.04%   52.34%    61.60%    36.79%
ZAPATA      36.93%   62.62%    52.77%    46.04%
CULBERSON   35.91%   63.00%    53.13%    44.57%
STARR       22.65%   76.72%    40.12%    58.06%
Would sure be nice to at least approximate those 2018 numbers again. This is why I fixate on the Latino subsample numbers in the polls, and why I note when one poll shows Talarico in the mid-50s while another shows him in the mid-60s. I’m not saying which is right and which is wrong, I’m just saying it makes a difference.
I recently moved to Grayson County, which is still vividly red, but I now work in Collin County and spend a lot of time driving around. Despite the latter’s reputation as a red enclave, all I see are Talarico (and to a lesser extent, Hinojosa) signs. I have never, ever seen a sign or bumpersticker for Paxton (in any county anywhere, actually).
That said, I remain unconvinced.
Re: COUNTY-LEVEL MARGIN GAINS
This be an interesting exercise, but Texas counties differ hugely in population size (and, correspondingly, in the number of eligible voters) and as far as partisan shifts and potential flippings of seats, only county-level races are directly affected. That can be (and often is, though not always) important locally.
Some county-level positions exist in all counties, but the same is not true of judgeships. In Harris County it’s dozens of trial court/judges that could be affected by a partisan shift while in small counties it’s only one position or just a few. But, in the big scheme of things, the most important races are not at the county level. Is all politics still local nonetheless?
COUNTY CONTRIBUTIONS TO VOTE TOTALS IN LARGER ELECTORAL UNITS
Assuming straight-ticket voting (for many voters), even small % shifts in populous counties will have a much more dramatic impact on the statewide totals (in state-level races) than the same % shift in a small county. That’s why Harris County is so important and was the focal point of vote promotion (Chris Hollins measures) and suppression efforts (much litigation). Keep in mind that Texas counties are not redistricted to make them roughly equal in population size.
To illustrate the order of magnitude, consider population as a correlate of county-level size of the respective electorates:
Harris County (Houston): 5,045,026
Collin County (McKinney): 1,297,179
Grayson County (Sherman): 153,613 (mentioned by Joel)
Caldwell County (Lockhart): 55,150
Full ranking data here: https://texascountymap.net/population
BOTTOM LINE: Whether a county becomes more blue (or reverse) may be important in deciding county-level races (depending on how competitive the county was previously), but beyond that, the impact of county-level partisan shifts (on statewide races and in larger electoral units, such as appellate court districts) will depend on the sheer size of the county (raw number of voters), not just a party’s (now Dems’) gain in the vote share (%) or margin.
In countly-level races, it’s a about flipping the county totals (to win), but even votes that go to the losing party in a red (nonflipping) county will contribute to blue totals in the geographically larger districts and the state as a whole. In other words, these votes are neither wasted nor lost.