
I have four things to say about this.
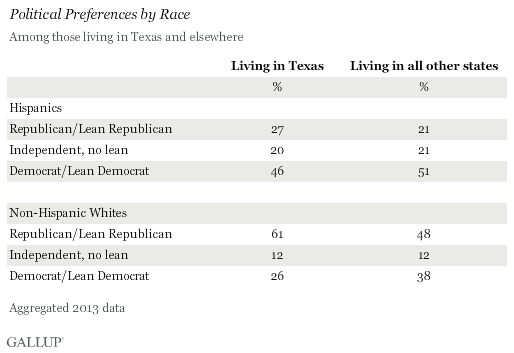
Texas Hispanics are decidedly Democratic in their political party preferences, 46% to 27%, but that 19-percentage-point Democratic advantage is much smaller in Texas than the average 30-point gap Democrats enjoy among the Hispanic population in the other 49 states. And white Texas residents are decidedly more Republican (61%) than the average among whites residing in other states (48%), complicating whether Texas will turn into a “blue” Democratic state in future elections.
With an increasingly large minority population, including the second-largest Hispanic population of any state, Texas has the potential to see a once-in-a-generation political re-alignment, which could transform the nation’s largest reliably Republican state.
These latest results come from 2013 Gallup Daily tracking poll data, which consists of 16,028 Hispanics nationwide, including 2,536 Hispanics residing in Texas. The Lone Star state is experiencing significant changes in its population — it is one of the top destinations for state to state migration — and these data provide a crucial, updated look into Texan Hispanics’ political preferences over the past year.
Texas holds a gubernatorial race this year, and some Democratic operatives are hoping Texas’ evolving demographic makeup will allow them to more effectively compete for the governor’s mansion. In 2010, Gov. Rick Perry was re-elected handily, defeating his Democratic opponent by 13 percentage points.
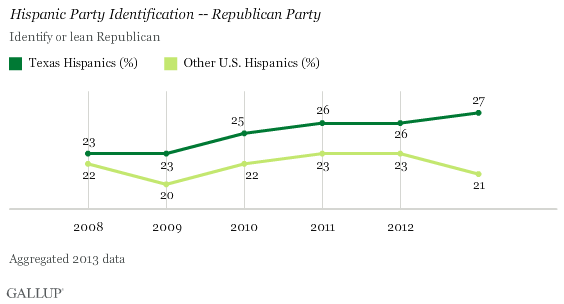
In Texas, GOP Making Small but Meaningful Gains With Hispanics
Relative to 2008 — the year of President Barack Obama’s landslide presidential victory — Texan Hispanics have gradually become more Republican, even as the percentage of Hispanics identifying with or leaning toward the Republican Party has remained relatively stable nationwide. The six-percentage-point gap between the percentage of Texan Hispanics and Hispanics living in all other states who identify or lean GOP is the highest it has been in over six years.
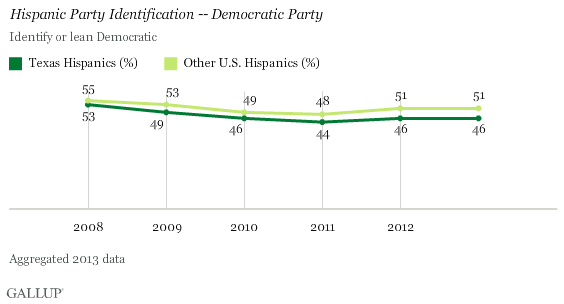
Meanwhile, Hispanics living in Texas have followed the broad national trend in terms of primarily identifying as Democrats. The 46% of Texan Hispanics who now lean or identify Democratic is seven points below the 2008 crest; by contrast, U.S. Hispanics living in the other 49 states report support of the Democratic Party that has declined by a slightly smaller four points between 2008 and 2013.
1. I presume this was a poll of registered voters. It would have been interesting if they had also asked about how often they voted in recent elections. There’s polling evidence that suggests lower-propensity Hispanics are almost as strongly Democratic when they do vote as African-American voters, while higher-propensity Hispanics are considerably less Democratic than Hispanic voters as a whole. Would have been cool to have gotten another data point on that. Be that as it may, it remains the case that Latinos heavily favor Democratic candidates, and even if the gap is smaller than it is nationally, there’s nothing to suggest that boosting turnout among them would be anything but an unalloyed good for Dems. And on a side note, at least this poll may mean that it will be cited as the “official” level of Latino support for the GOP in Texas, and not whatever figure Mike Baselice retrieves from his nether regions. For that and that alone, this is a good result.
2. I’m deeply suspicious of that 20% “Independent/No Lean” number. There’s scads of evidence nationally to show that the number of true could-go-either-way indies is tiny, and they’re usually a proxy for the less engaged folks that just plain don’t vote much. Again, an additional question or two about recent voting history, broken out by R/D/I would have been instructive. If I had to bet, I’d say some of these respondents don’t vote much, and some others may just be mad at their party for whatever the reason and refuse to identify with them. Self-declared party ID moves around a lot more than actual voting behavior.
3. As far as the poll result goes, I think the level of Latino support for Republicans is about right, but I’m not sure about the trend. I’ve discussed this topic ad nauseum, so let me just cut to the chase and say that by every indicator I’ve examined, the level of support for Democratic candidates in Latino areas went up from 2008 to 2012, not down. I’ll repeat myself one more time and say that some questions about actual voting behavior would have shed a lot more light on this survey. Being me, I couldn’t leave it at this and got to wondering if there were some other way to corroborate or contradict the evidence from this poll. What I came up with was to look at the level of Republican primary voting in some heavily Latino counties. Here are the numbers:
GOP primary turnout

County         2008     2010     2012
=====================================
Cameron       4,822    4,601    5,311
El Paso      18,727   15,386   11,556
Hidalgo       5,753    5,015    6,401
Webb          1,232    1,224    1,189

Total        30,534   27,221   24,457


Registered voters

County         2008     2010     2012
=====================================
Cameron     167,656  171,024  174,077
El Paso     372,000  375,128  371,321
Hidalgo     290,454  290,097  291,724
Webb        100,606  105,012  106,579

Total       930,716  941,261  921,701
Let’s be clear, this is an extremely crude measure. I wouldn’t use this to make a point, I’m just looking to see if there’s any correlation to the Gallup charts. The answer appears to be “not really”. The numbers ticked up in Cameron and Hidalgo, and declined in El Paso and Webb. Note that even in these predominantly Latino counties, the people casting these GOP primary votes could still be majority Anglo. We just don’t know. All I can say is that this tidbit of anecdotal evidence neither corroborates nor refutes the hypothesis. I’d need a much more precise measuring tool to be able to say.
4. While the Latino support for Republicans feels about right to me in this poll, the Anglo support for Republicans feels a little low. I’d have pegged it closer to 70%, based on polls and results from 2012. I have a hypothesis that will drop a couple of points post-Obama, but that’s just intuition, not based on any empirical evidence. I do think Wendy Davis et al will need to chip into that if she/they want to have a shot at winning this fall. I think if the Rs are getting only 61% of the Anglo vote in November, they could be in trouble.