
PREVIOUSLY
Beto versus Abbott
Beto versus the spread
Hidalgo versus Mealer
Better statewide races
Not as good statewide races
County executive offices
Houston/not Houston
I’ve spent a lot of time and space on this blog talking about judicial races and trying to make sense of their numbers. As we’ve discussed, there is consistently a three-to-four point range between the top-scoring Democratic judicial candidate and the lowest-scoring one. That range is consistent across years, across baseline Democratic performance levels, across different types of judicial races. I’ve looked but never found patterns that I think satisfactorily and consistently explain the variations.
This was an interesting year for multiple reasons – the first non-Presidential election since the huge shift towards Democrats in 2018, the first time these judicial incumbents were running for re-election, tons of money being spent by Republicans and their backers to smear Criminal Court judges, the high-profile County Judge race that was closely tied to that same campaign spending, the first non-Presidential year with no straight-ticket voting, coming in a year with the extra-long ballot and so on. There were a lot of contradictory polls and a lot of dubious conventional wisdom, including questionable pronouncements about voters getting worn out before they reached the end of the ballot, and how that would be bad for Democrats.
In the end, the results largely defied negative pronouncements about Democrats’ chances. I turn as always to the numbers to see what they tell us. One way that I decided to approach this was to look at the different type of judicial races on the ballot, to see if there was anything interesting there. Turns out there was:
Court         R Avg    D Avg    R pct   D pct
=============================================
Appeals     520,019  549,533   48.62%  51.38%
Dist Civil  518,475  545,206   48.74%  51.26%
Dist Crim   520,900  542,986   48.96%  51.04%
Family      508,801  546,195   48.23%  51.77%
C Civil     515,292  545,092   48.60%  51.40%
C Crim      522,321  534,175   49.44%  50.56%
C Probate   511,900  540,619   48.64%  51.36%
You may have noticed that the ballot is arranged in a particular order. At a high level, it’s federal races, then state races, then county races, then city and other local entities if applicable. In this context, after the statewide offices and the legislative offices (including the SBOE), there are the judicial races. They start with the appellate courts, the 1st and 14th for those of us in Harris County, then the District Courts in numerical order, which means that Criminal District Courts and Civil District Courts are mixed together. Last in line for the state courts are the Family Courts, also in numerical order. After the last Family Court race is the County Judge, the top race in the county, and then the County Civil courts, the County Criminal courts, and finally the County Probate courts. (I am not taking the Justice of the Peace courts into consideration here, as they are not countywide and you only have one of them on your ballot.)
That’s the order displayed in the table above, so each line represents a group that came entirely after the group above it. I took the average number of votes each party’s candidates got in these races – I omitted the one Appellate Court race that had a third candidate in it so that we’d have a cleaner comparison – and the average vote percentage for each group, which you see in the table.
Breaking it down this way revealed three things to me that I might not have noticed otherwise. One is that the many millions of dollars spent by the Mealer/Mattress Mack cohort did have some effect, specifically in the criminal court races, with that effect being slightly larger in the county courts than in the district courts. Republican criminal court candidates, at both the district and county levels, actually got more votes on average than their civil court counterparts, while the Democrats in those races got fewer votes than their civil court colleagues. It’s not clear to me why the gap was greater in the county (which is to say, misdemeanor) courts; the anti-Democratic advertising wasn’t at all subtle about who was responsible for whatever outrage they were fulminating about. To the extent that it did work, the voters seemed to understand the difference between “criminal courts” and “not criminal courts”. If anyone on the Republican side thought that the other Democratic judges might become collateral damage, there’s no evidence to support that.
Two, the Family Court judges were the stars of the 2022 elections for the Democrats. The gap is the greatest between them and their Republican challengers, and they got the most votes in the aggregate of any non-appellate group. They may have drawn some support from people who otherwise voted Republican, or they got more people who might have been skipping other judicial races to push their buttons. Again, I don’t know exactly why. Just eyeballing the 2018 results – I may go back and do these calculations for that year, just as a point of comparison – I think the Dems that year did better overall than in other races, though they had about the same range of results. One thought I’ve had about this is that the Family Courts were kind of a mess before the Dem sweep of 2018 – there were some stories that made it into the papers about happenings in the Family Courts, and of course there was then-Family Court Judge Lisa Millard ruling against the city of Houston giving health insurance benefits to same-sex spouses of city employees even after DOMA had been ruled unconstitutional by SCOTUS. Maybe there’s a general impression among (at least some) voters that Republicans can’t be trusted on Family Court benches, in the way that Republicans tried to push than message about Dems on Criminal Court benches. I’m just guessing – the evidence is minimal, there aren’t that many of these races, the gap isn’t that much – but it’s what I’ve got.
And three, there’s no evidence to support the hypothesis that I have seen too many times that “ballot fatigue” disproportionately hurts Democratic candidates. Democratic Probate Court judges, all the way at the bottom of the ballot, did basically as well as their counterparts in appellate and civil court races. The dropoff in votes cast for each party from appellate to probate, and from county civil to probate, is about the same; the dropoff from district civil to probate favors the Dems. If anyone thought that eliminating straight ticket voting would give Republicans more of a chance to win these farther downballot races because Dems would lose interest or get tired or whatever, they were wrong. I made this point till I was sick of having to make it back in 2018 and again in 2020. I will never not be mad about all of the lazy, uninformed, and frankly kind of racist assumptions that went into that hypothesis.
Let me close with a visual reminder of all this. The table above is the average vote and percentage for the different types of judicial races. The chart below is the vote percentage for both parties in each of those races individually.
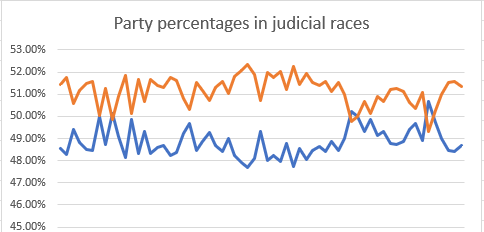
The Y-axis is the percentages. The X-axis is where they are on the ballot, so on the left we start with the appellate races, then go through the district and family courts, then into the county civil, criminal, and finally probate courts. You can see the four races that Dems lost, one district criminal court and three county criminal courts.
And as you can see, while there is that dip in percentage that we have discussed for the county criminal courts, it bounces right back for the probate courts. There’s no overall downward trend. Many millions of dollars in advertising was able to move the needle a bit in a handful of races, but that’s it.
I still have a couple more of these posts to work through. As always, please let me know what you think.
Pingback: Texas blog roundup for the week of February 6 – Off the Kuff