
From Daily Kos:
Texas’s GOP-drawn congressional map was designed to create 24 safely red seats and 11 safely Democratic districts, with only the 23rd District in the western part of the state being truly competitive. In 2012, Mitt Romney carried the state 57-41 and won those 24 red seats by double digits, while Barack Obama easily carried the 11 Democratic districts; the 23rd backed Romney 51-48.
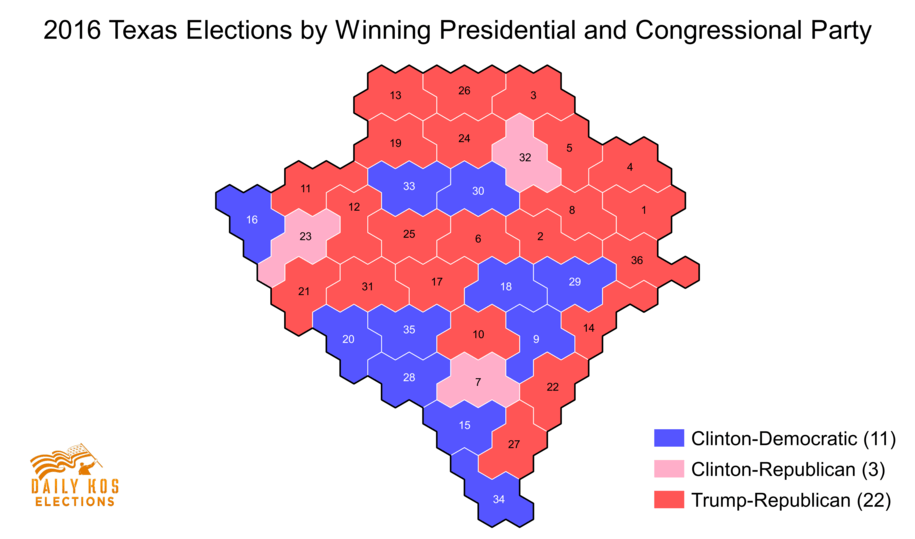
Things were a lot more interesting in 2016, with Donald Trump defeating Hillary Clinton by a smaller 52.5-43.5 margin, the closest presidential election in Texas in decades. Clinton won all the Obama districts, as well as the 23rd and two solidly Romney seats, the 7th and 32nd. However, the GOP still holds all the districts that Romney won in 2012, while Democrats have all the Obama/Clinton districts. The map at the top of this post, which shows each district as equally sized, illustrates all this, with the three Romney/Clinton districts standing out in pink.
We’ll start with a look at Texas’s 23rd District, which stretches from El Paso to San Antonio and went from 51-48 Romney to 50-46 Clinton. However, the swing wasn’t quite enough for Democrats downballot. Republican Will Hurd narrowly unseated Democrat Pete Gallego in the 2014 GOP wave, and he won their expensive rematch by a similarly tight 48-47 margin.
Surprisingly, two other Texas Republicans have now found themselves sitting in seats Clinton won. Romney easily carried the 7th, located in the Houston area, by a wide 60-39 spread, but the well-educated seat backed Clinton by a narrow 48.5-47.1. Republican Rep. John Culberson still decisively turned back a challenge from a perennial candidate 56-44, and it remains to be seen if Democrats will be able to field a stronger contender next time—or whether the GOP’s weakness at the top of the ticket was a one-time phenomenon due solely to Trump.
The 32nd in the Dallas area also swung wildly from 57-41 Romney to 49-47 Clinton. However, Democrats didn’t even field an opponent against longtime GOP Rep. Pete Sessions, a former head of the NRCC who’s capable of raising as much money as he needs to in order to win. This is another well-educated seat where we’ll need to see if Democrats will be able to take advantage of Trump’s weaknesses, or if The Donald’s 2016 problems don’t hurt the GOP much downballot in future years.
Seven other Republican-held seats also moved to the left by double digits. The closest result came in Rep. Kenny Marchant’s 24th District in the Dallas-Forth Worth suburbs, which Trump won just 51-45 after Romney cruised to a 60-38 win four years earlier. Marchant beat a penniless opponent 56-39, so this district could also wind up on Democratic watch lists.
They mention a few other districts in which Clinton exceeded Obama’s numbers by a significant amount; I’ll get to that in a minute. I’ve discussed CD07 and CD32 before. We know that while Clinton carried CD07, it was largely due to Republican crossovers, as the average judicial race clocked in at a 56.5% to 43.5%b advantage for Trump. I can now make a similar statement about CD32, as I have been working my way through the canvass data in Dallas County. (CD32 reaches into Collin County as well, but I don’t have canvass data for it. The large majority of the district is in Dallas County, however.) Hillary Clinton won the Dallas County portion of CD32 by ten thousand votes, basically 127K to 117K. No other Democrat in Dallas County carried CD32, however. Looking at the judicial races there, Trump generally led by 20K to 25K votes, so the crossover effect was significant. The closest any Dem came to matching Clinton in CD32 was two-term Sheriff Lupe Valdez, who trailed in the Dallas portion of CD32 by a 125K to 116K margin.
I may go back later and look at CD24, about forty percent of which is in Dallas County, and I will definitely look at CD23 when we have full statewide numbers. If you had told me that Clinton would carry CD23, I’d have been sure that Pete Gallego would reclaim the seat, but that didn’t happen. I’ve got to give credit to Rep. Will Hurd for that, though I doubt he will ever have an easy time of it going forward. As for the other districts, I’ll just say this: Back when we were all getting intoxicated by the alluringly tight poll numbers in Texas, I ran the numbers in every district to see what might happen if you adjusted the 2012 returns to reflect a 50-50 Presidential race. The short answer is that while several Congressional districts become a lot more competitive, none of them swing to majority Dem, even under those much more favorable circumstances. This is a testament to how effective that Republican gerrymander is, and a sobering reminder of how much ground there is to recover before we can make any gains. The 2016 Presidential numbers may tantalize, but they are illusory.
One more thing: The full 2016 Congressional numbers, along with the corresponding 2012 numbers, are here. Let me break them down a bit:
Trump up, Clinton down

Dist   Romney   Trump   Obama  Clinton  R Diff  D Diff
======================================================
CD01     71.6    72.2    27.5     25.3    +0.6    -2.2
CD04     74.0    75.4    24.8     21.8    +1.4    -3.0


Trump down, Clinton down

Dist   Romney   Trump   Obama  Clinton  R Diff  D Diff
======================================================
CD05     64.5    62.7    34.4     34.3    -1.8    -0.1
CD11     79.2    77.8    19.6     19.1    -1.4    -0.5
CD13     80.2    79.9    18.5     16.9    -0.3    -2.6
CD14     59.3    58.2    39.5     38.4    -1.1    -1.1
CD15     41.5    40.0    57.4     56.7    -1.5    -0.7
CD19     73.6    72.5    25.0     23.5    -1.1    -1.5
CD27     60.5    60.1    38.2     36.7    -0.4    -1.5
CD28     38.7    38.5    60.3     58.3    -0.2    -2.0
CD30     19.6    18.3    79.6     79.1    -1.3    -0.5
CD34     38.3    37.7    60.8     59.2    -0.6    -1.6
CD36     73.2    72.0    25.7     25.2    -1.2    -0.5

Trump down, Clinton up

Dist   Romney   Trump   Obama  Clinton  R Diff  D Diff
======================================================
CD02     62.9    52.4    35.6     43.1   -10.5    +7.5
CD03     64.3    54.8    34.2     40.6    -9.5    +6.4
CD06     57.9    54.2    40.8     41.9    -3.7    +1.1
CD07     59.9    48.5    38.6     47.1   -11.4    +8.5
CD08     77.0    72.7    21.7     23.9    -4.3    +2.2
CD09     21.1    18.0    78.0     79.3    -2.9    +1.3
CD10     59.1    52.3    38.8     43.2    -6.8    +4.4
CD12     66.8    62.9    31.7     32.7    -3.9    +1.0
CD16     34.5    27.2    64.2     67.9    -7.3    +3.7
CD17     60.4    56.3    37.7     38.8    -4.1    +1.1
CD18     22.8    20.0    76.1     76.5    -2.8    +0.4
CD20     39.7    34.3    58.9     61.0    -5.4    +2.1
CD21     59.8    52.5    37.9     42.5    -7.3    +4.6
CD22     62.1    52.1    36.7     44.2   -10.0    +7.5
CD23     50.7    46.4    48.1     49.7    -4.3    +1.6
CD24     60.4    50.7    38.0     44.5    -9.7    +6.5
CD25     59.9    55.1    37.8     40.2    -4.8    +2.4
CD26     67.6    60.9    30.7     34.4    -6.7    +3.7
CD29     33.0    25.4    65.9     71.1    -7.6    +5.2
CD31     59.6    53.5    38.3     40.8    -6.1    +2.5
CD32     57.0    46.6    41.5     48.5   -10.4    +7.0
CD33     27.1    23.7    72.0     72.9    -3.4    +0.9
CD35     34.6    30.5    63.0     64.1    -4.1    +1.1
You want to know why we’ll never get rid of Louie Gohmert? He represents CD01, one of two districts where Trump improved on Mitt Romney’s numbers. That’s why we’ll never get rid of Louie Gohmert. In the other districts, the main difference between 2016 and 2012 is the performance of third party candidates, especially Libertarian Gary Johnson. I don’t have vote totals, and the dKos spreadsheet doesn’t include the other candidates, so it’s hard to say exactly what happened at this time. For sure, in some of these districts, there was a shift towards the Democrats. I’ve noted before that the “true” level of Democratic support in CD07 was about 43.5%, but that’s still four or five points better than it was in 2012. When the full statewide numbers come out, probably next month, I’ll be able to do more detailed comparisons. For now, this is what we have. Look over the dKos data and see what you think.