
One more day of early voting to go:
Year    Early    Mail    Total   Mailed
=======================================
2015  128,611  27,952  156,563   43,280
2013   68,803  20,491   89,294   30,572
The running 2015 totals are here, the full 2013 totals are here, and for completeness the full 2009 totals are here. As noted yesterday, we have exceeded the 2013 early voting totals for Harris County as of Tuesday, and are up about 75% overall. How big is this thing going to get? Mike Morris takes a stab at it:
With two days of early voting left, Houston voters already have outpaced total votes cast in the November 2011 election. Are we on pace for a huge spike in turnout this fall?
Not necessarily.
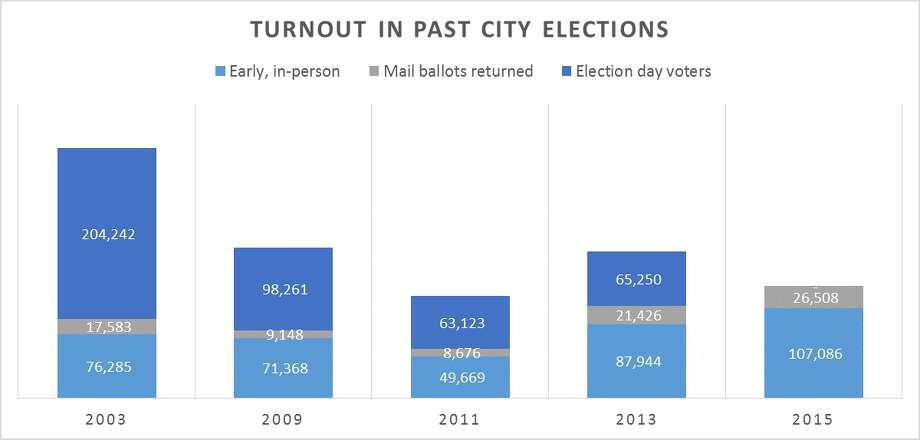
As the chart shows, the city has seen a steady increase in the share of votes being cast early, as more Houstonians figure out that it’s easier to go to any of the open locations and often avoid a line than it is to vote at your assigned polling place on Election Day with all of your neighbors.
From 2003 forward, the share of votes cast early has steadily risen from less than one-third to nearly two-thirds during the last cycle in 2013.
[…]
It’s not really my job to guess, but political scientists have been estimating that this year’s turnout could fall between 180,000 and 240,000. With the early votes likely to come in today and tomorrow, that would track with a continuing share of people voting early.
I will note, however, that at this point if we only see 180,000 total votes (as we did in 2009) that will mean almost no one shows up on Tuesday, so expect a higher number than that.
Most observers have assumed a higher turnout is bad news for the Houston Equal Rights Ordinance, as city progressives already vote in high numbers. Thus, the next level of analysis is to see which early voting locations have seen spikes in turnout.
Actually, the next level is to get the daily rosters and figure it out at a more granular level, since as Morris notes you can’t go by EV locations except as a fairly rough estimate. Fortunately, Greg has done this work, and you should go look at his post. I’m going to take his main chart and add a little something to it:
==============================================
Neighborhood   15EVTO%   13EVTO%  13TO%  13EV%
==============================================

African-American Neighborhoods
----------------------------------------------
Southside AfrAm   9.7%     9.3%   18.9%  49.2%
Northwest AfrAm  12.4%     9.6%   18.1%  53.0%
Fifth Ward        8.9%     7.4%   16.2%  45.7%
Hiram Clarke     10.2%     9.0%   17.8%  50.6%

Hispanic/Latino Neighborhoods
----------------------------------------------
Lindale           8.7%     7.2%   16.4%  43.9%
East End          6.2%     6.3%   15.2%  41.4%

Anglo GOP Neighborhoods
----------------------------------------------
Kingwood         18.7%    11.8%   22.5%  52.4%
Clear Lake       12.3%    11.6%   24.3%  47.7%
West             14.3%    11.8%   27.1%  43.5%

Anglo Dem/Swing Neighborhoods
----------------------------------------------
Sharpstown        9.9%     9.3%   19.9%  46.7%
Meyerland        10.6%    12.5%   34.6%  36.1%
Heights - C       9.0%     8.8%   25.3%  34.8%
Montrose         12.3%    11.5%   27.6%  41.7%
My addition is that last column, which shows how much of the total vote in these locations (see Greg’s post for the exact precincts in question) comes early. For whatever the reason, the Heights and Meyerland seem to like voting on Election Day, or at least they did in 2013; in a subsequent post, Greg suggests Meyerland’s 2013 performance may have been an outlier. Regardless, this is especially noteworthy when you consider how much of the overall vote in 2013 came early. Here’s a look at that trend, based on the chart in Morris’ story:
Year    Early    E-Day    Total  Early%
=======================================
2003   93,868  204,242  298,110   31.5%
2009   81,516   98,261  179,777   45.3%
2011   58,345   63,123  121,468   48.0%
2013  109,370   65,250  174,620   62.6%
One of those things is not like the others. Certainly, as Morris says, some people will vote on Election Day. Let’s guess that the early vote total, which includes absentee ballots, is between 65 and 70% of the final amount. I’ll run some number for that after all of early voting is done, but whatever reasonable figure you choose, turnout will be up by some amount. What does this mean for HERO? The third level of analysis would be to look at voting history, and to focus on the people who don’t have any history of voting in city elections. Those folks can be broken into two groups. The first group is those with no voting history at all. They will predominantly be new arrivals to Harris County, with a few people who are newly of age and a few others who for whatever the reason had not been registered before. In the absence of any polling data specifically on that type of new voter, I’m not going to guess what their HERO preference may be. The second group is those that have voted in even year elections, but not odd year elections. These are the people who have come out specifically for this election, and it’s fair to say that HERO is the most likely reason for that. One may then reasonably guess based on where they live and what other elections they have voted in which way they probably lean. How many of these people are there? I have no idea, but I’m certain that the various campaigns do. You want to get a sense of how the wind is blowing, that’s where you should put up your weather vane.
Pingback: Day 12 EV 2015 totals: Final turnout projections – Off the Kuff