
On the eve of the first presidential debate of the 2020 electoral season, Univision News publishes its latest electoral polls: the National Latino Voter Poll, a survey that interviewed a representative sample of all Latino registered voters nationwide, and the Arizona, Texas and Florida Latino Voter Polls, which interviewed a representative sample of all Latino registered voters in each state.
These new polls reveal the diversity and complexity of the Latino electorate current political preferences, voting intention, concerns, opinions on recent developments, views on President Trump, Joe Biden and much more.
Complete results of the polls are now available at UnivisionNoticias.com and via all Univision News digital and social media platforms. Additionally, highlights of the findings will be featured in Univision’s programming, from its morning show “Despierta América, to the different editions of its daily “Noticiero Univision” newscasts and its public affairs program “Al Punto”.
Overseen by Dr. Sergio García-Ríos, Director of Polling for Univision News, the surveys were conducted by the polling firms Latino Decisions and North Star Opinion Research from September 17 – 24, 2020. The Latino Texas Voter Poll was commissioned through a partnership between Univision News and the Center for Mexican American Studies (CMAS) at the University of Houston.
- 46% of Latinos oppose moving forward with appointing a replacement to the Supreme Court before the election, while 41% are in favor.
- Biden leads Trump by 42 points among registered Hispanic voters, but in the key state of Florida that advantage has dropped to only 16 points.
- Trump’s overall approval among Hispanics is 30%, but in Florida it’s 39%.
- The coronavirus is the biggest concern for 40% of Hispanics, while 73% disapprove of Trump’s management of the pandemic and 61% believe that Biden would have handled it better.
- About half of Hispanics (48%) plan to vote by mail, although in Texas, where not all voters have that option, the number is only 33%.
- 76% of Hispanics support the protests that have occurred in recent days over the death of African Americans at the hands of the police, and 58% would welcome a reduction in funding for the police.
- 59% of Hispanics believe that Biden would do better on the subject of law and order, which is one of Trump’s main slogans.
- In contests for the Senate in the key state of Arizona, 55% of Latinos favor Democrat Mark Kelly over 21% for Martha McSally. In Texas MJ Hegar leads with 47% against 30% for John Cornyn.
To see full cross tabulations and methodology of the National Latino Voter Polls, click here.To view the complete results of the polls, please go to UnivisionNoticias.com.
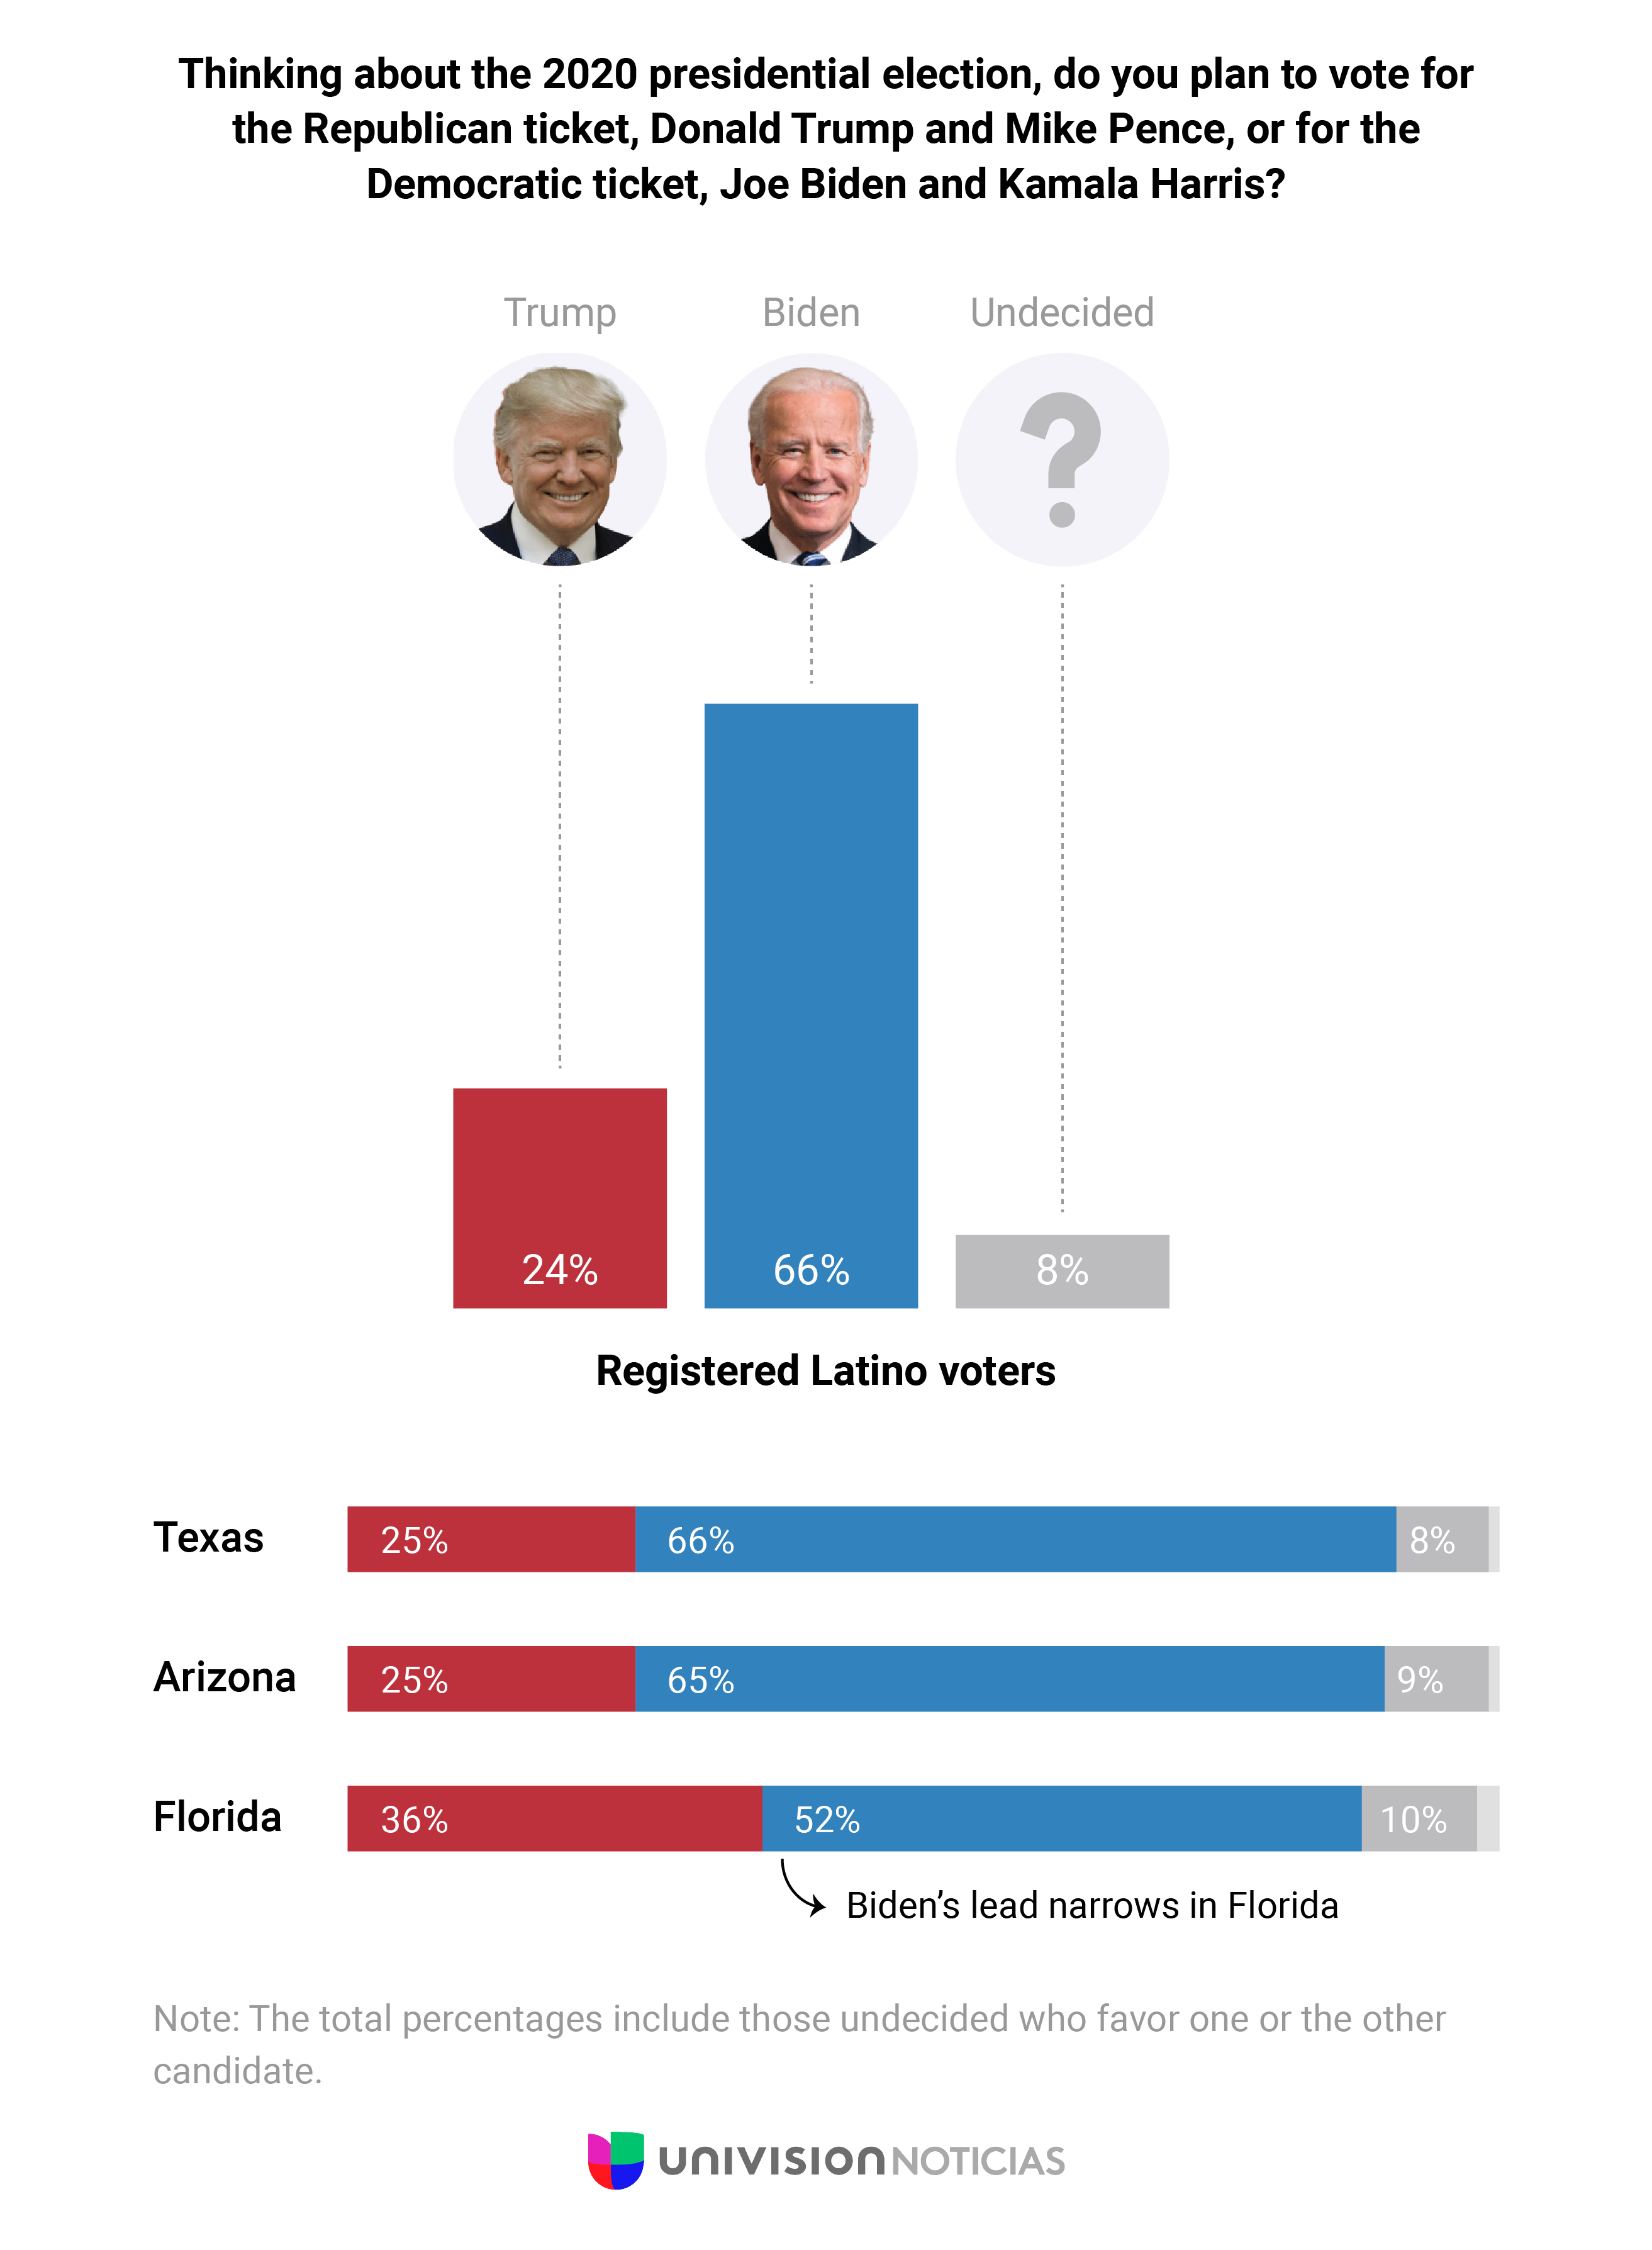
Here’s a more detailed writeup, and here are the questions and crosstabs. The topline numbers are 66-25 for Biden among Latinos in Texas. For MJ Hegar, it’s 47-30 against John Cornyn, but with a significant undecided contingent, which if you dig through those crosstabs is much more Democratic.
On the other hand, we have this:
President Donald Trump has an apparent lead over former Vice President Joe Biden in a close contest for Texas’ 38 electoral votes according to a new poll of likely voters in the state released today.
Trump has the support of 49 percent of Texas likely voters, Biden is at 46 percent, other candidates on the ballot are at 4 percent and 1 percent are undecided. The poll of 882 likely voters carries a margin of error of plus or minus 4.3 percent.
While male poll respondents are more likely to vote for Trump (52 percent Trump, 42 percent Biden), Trump is polling nearly even with Biden among women in Texas (49 percent Biden, 47 percent Trump); Biden likely needs to widen the gender gap in order to carry the state.
More on voters’ support by party, age and education is available at www.uml.edu/polls.
While Trump is slightly ahead of Biden with likely voters, 50 percent say they approve and 49 percent disapprove of the president. Among those who approve, 37 percent do so strongly and 13 percent somewhat. Among Trump disapprovers, 40 percent strongly disapprove of the way he is handling his job as president. Among Democrats, 95 percent disapprove of Trump’s job performance, including 83 percent who strongly disapprove. Among independents, 60 percent disapprove of his job performance, including 39 percent who strongly disapprove. Among the 92 percent of Republicans who approve of Trump’s job performance, 69 percent strongly approve.
“Trump is hanging onto a lead in Texas, but Republicans shouldn’t be celebrating. Once a stronghold, statewide races continue to tighten and a loss in Texas would not only guarantee a Biden presidency, it would signal a landslide. The fact that Biden is keeping it close is cold comfort,” said Joshua Dyck, director of the UMass Lowell Center for Public Opinion and associate professor of political science.
[…]
In the closely watched U.S. Senate race in Texas, Republican incumbent John Cornyn leads Democratic challenger MJ Hegar 50 percent to 40 percent with 1 percent saying they will vote for another candidate and 9 percent undecided.
While Cornyn leads by a comfortable margin, his lead also does not necessarily project strength, rather that he is running against a relatively unknown challenger. Cornyn is leading among Republicans 91 percent to Hegar’s 3 percent, while Hegar leads among Democrats 83 percent to 7 percent. However, Hegar also leads among independents by 9 points, 44 percent to 35 percent. Notably, 10 percent of Democrats and 11 percent of independents remain undecided, compared to only 6 percent of Republicans.
As a challenger, Hegar’s relative anonymity among Texas voters shows up in her favorables. She has a net favorability rating of +13 (35 percent to 22 percent), but a large number of Texas voters either have no opinion of her (26 percent) or have never heard of her (17 percent). Cornyn, by contrast, is not a particularly popular incumbent. His favorability rating is net neutral (38 percent favorable, 38 percent unfavorable), while 19 percent of likely voters have no opinion of the senator and 5 percent have never heard of him.
Links to more about the poll can be found here. Why am I grouping this with the Univision/Latino Decisions poll? Because if you look in the crosstabs, Latinos support Biden in this poll by the shockingly small amount of 49-45, with Cornyn leading Hegar among Latinos 44-41. UML also has Black voters giving Trump 16% support, so as with some other polls this may just be some small sample weirdness. But as we’ve discussed before, modeling what Latino voters will do this election, especially in Texas, has produced some wildly divergent results.
This Chron story about that first poll captures what I’m talking about:
Tuesday’s results also aligns with previous polling that has Biden up over Trump among Latinos, though by how much has varied depending on the poll.
An August poll by the Texas Hispanic Policy Foundation and Rice University’s Baker Institute put Biden up by 9.5 points among Texas Latinos. A Quinnipiac University poll last Thursday had Biden up by 8 points, and a smaller survey by the New York Times and Siena College had Biden up 25.
[UH poli sci professor Jeronimo] Cortina attributed the variation in poll results to small sample sizes that don’t fully encompass the breadth of types of Latino voters.
I mentioned the Quinnipiac poll and the Texas Hispanic Policy Foundation poll earlier in this post, with the latter including a roundup of other polls that had this subsample data in it at the time. My quick scan of all the results suggests that maybe three fourths of polls of Texas have Trump’s level of support among Latinos in the 20-30 range, mostly 25-30, and the rest have him around 40. Needless to say, they can’t both be right. I tend to believe the former group, and the results of a large Latinos-only poll like this one and its predecessor carry more weight since they have much larger sample sizes, but we just don’t know for sure. I’m just trying to highlight the evidence that we have.
Pingback: UT/Trib: Trump 50, Biden 45 – Off the Kuff